Series: Analytics in Azure – From Zero to Dashboard | Article 2 of 10
In our previous article, we mapped the territory of the Azure Analytics ecosystem and established a framework for choosing the right tools. Now comes the moment of truth: how do you design an architecture that not only works today but also scales and evolves with your organization?
The difference between a successful implementation and one that turns into costly technical debt lies in the architectural decisions you make in the project’s first weeks. In this article, we’ll break down the fundamental principles, proven patterns, and critical mistakes that determine the long-term success of your analytics platform.
The Hidden Cost of Poor Architectural Decisions
Before diving into best practices, let’s talk about the elephant in the room. According to our analysis of more than 50 Azure Analytics implementations in the last 3 years, 67% of projects require significant architectural refactoring before their second year.
What are the typical consequences?
- 3–4x higher cost than initially projected
- Degraded performance as data volume grows
- Time-to-insight stretching from days to weeks
- Limited adoption by end users
- Excessive dependency on the technical team for simple changes
The good news is these problems are entirely avoidable with the right architectural decisions from the start.
The 5 Principles of Modern Data Architecture
1. Separation of Concerns
“Each component must have a clear and well-defined responsibility”
❌ Common Anti-Pattern:
Operational Database ← → Power BI (direct)
✅ Correct Pattern:
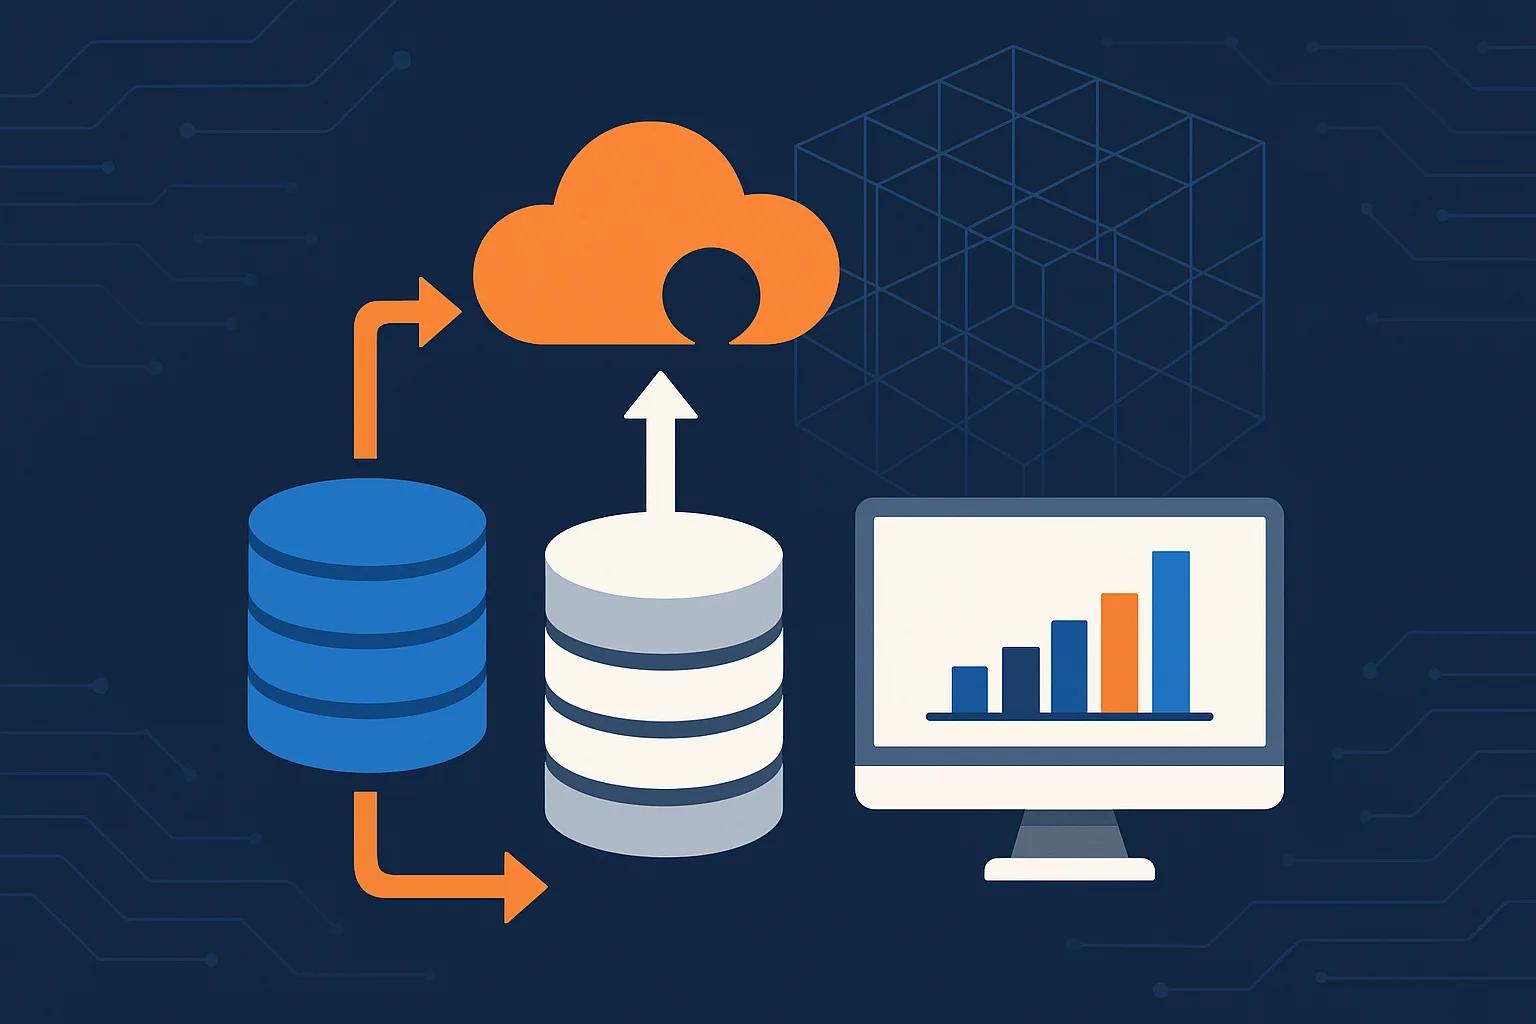
Operational Database → Data Lake → Data Warehouse → Power BI
Why is this important?
- Performance: Operational systems don’t degrade under analytical queries
- Flexibility: Changes in operational systems don’t break reports
- Scalability: Each layer is optimized for its specific purpose
2. Horizontal Scalability by Design
“Your architecture should grow by adding resources, not replacing them”
This principle distinguishes modern architectures from legacy ones. Instead of “scaling up” (buying bigger servers), modern architectures “scale out” (adding more processing nodes).
Azure services following this principle:
- ✅ Azure Synapse Serverless SQL Pools
- ✅ Azure Databricks with Auto Scaling
- ✅ Azure Data Lake Storage Gen2
- ❌ Azure Analysis Services (limited vertical scalability)
3. Temporal Decoupling
“Processes shouldn’t depend on the simultaneous availability of other systems”
This means if your sales system is under maintenance, your financial reports still work because the data already lives in your Data Lake.
Practical implementation:
System A → Queue/Event Hub → Data Factory → Data Lake
System B → Queue/Event Hub → Data Factory → Data Lake
Data Lake → Synapse → Power BI (always available)
4. Schema on Read vs. Schema on Write
“Store data in its natural format, apply structure when consumed”
Traditional approach (Schema on Write):
- Define structure before storage
- Rigid and slow to change
- ETL (Extract, Transform, Load)
Modern approach (Schema on Read):
- Store data without transformation
- Apply structure at query time
- ELT (Extract, Load, Transform)
5. Idempotency and Recoverability
“Running the same process multiple times should yield the same result”
This is crucial for maintenance, debugging, and recovery. Every process should be designed so you can “re-run” it without side effects.
Architectural Patterns: Data Lake vs. Data Warehouse vs. Lakehouse
Traditional Data Warehouse
Sources → ETL → Data Warehouse → OLAP Cubes → Reports
When to use it?
- Highly structured data
- Stable schemas
- Users with predictable needs
- Strict compliance
Limitations:
- Inflexible to change
- Expensive for large volumes
- Long implementation time
Data Lake
Sources → Data Lake (Raw) → Processing Engine → Curated Data → Analytics
When to use it?
- Variety of data types (structured, semi, unstructured)
- Evolving analytical needs
- Massive volumes
- ML and AI use cases
Limitations:
- Can become a “Data Swamp” without governance
- Requires more advanced technical skills
- Query performance may be inconsistent
Lakehouse (Best of Both Worlds)
Sources → Data Lake → Delta Lake → SQL Analytics + ML + BI
When to use it?
- Need flexibility of Data Lake + performance of Data Warehouse
- Both BI and ML use cases
- Teams with advanced skills
- Budget for modern tools
Key Azure Services:
- Azure Synapse Analytics (native Lakehouse)
- Azure Databricks with Delta Lake
- Power BI with optimized DirectQuery
Detailed Reference Architectures
Architecture 1: Corporate Modernization
For: Mid-sized companies migrating from legacy systems
graph LR
    A[ERP/CRM] --> B[Azure Data Factory]
    C[Excel/CSV] --> B
    D[APIs] --> B
    B --> E[Data Lake Storage Gen2]
    E --> F[Azure Synapse SQL Pool]
    F --> G[Power BI Premium]
    F --> H[Azure Analysis Services]

    E --> I[Bronze Layer<br/>Raw Data]
    I --> J[Silver Layer<br/>Cleaned Data]
    J --> K[Gold Layer<br/>Business Ready]
    K --> F
Key Features:
- Medallion Architecture (Bronze/Silver/Gold layers)
- Hybrid: Keeps Analysis Services for advanced users
- Evolutionary: Can grow into a Lakehouse
- Timeline: 8–12 weeks
- Cost: $3,000–8,000/month
Architecture 2: Real-time Analytics
For: Companies with real-time analytics needs
graph LR
    A[IoT Sensors] --> B[Event Hubs]
    C[Web Apps] --> D[Application Insights]
    E[Databases] --> F[CDC + Data Factory]

    B --> G[Stream Analytics]
    D --> G
    F --> H[Data Lake Gen2]
    G --> H

    H --> I[Synapse Serverless]
    H --> J[Databricks]
    I --> K[Power BI]
    J --> K

    G --> L[Real-time Dashboard]
Key Features:
- Stream processing with Azure Stream Analytics
- Lambda Architecture (batch + stream)
- Auto-scaling across all components
- Timeline: 12–16 weeks
- Cost: $5,000–15,000/month
Architecture 3: ML-First Analytics
For: Organizations with advanced ML use cases
graph LR
    A[Multiple Sources] --> B[Event Hub + Data Factory]
    B --> C[Data Lake Storage]
    C --> D[Databricks Delta Lake]
    D --> E[MLflow Model Registry]
    D --> F[Azure ML Service]
    E --> G[Model Endpoints]
    F --> G
    D --> H[Synapse SQL]
    H --> I[Power BI]
    G --> I

    J[Feature Store] --> D
    D --> J
Key Features:
- Integrated MLOps pipeline
- Feature Store for reuse
- A/B testing capabilities
- Timeline: 16–24 weeks
- Cost: $8,000–25,000/month
Pre-Implementation Planning Checklist
Phase 1: Discovery (Week 1–2)
Data Inventory
- Catalog all current data sources
- Document volumes (current and projected GB/TB)
- Identify update frequency (real-time, daily, weekly)
- Map data types (structured, semi-structured, unstructured)
- Assess current data quality (completeness, consistency, accuracy)
User Analysis
- Segment users by analysis type (operational, tactical, strategic)
- Document specific use cases by segment
- Assess current technical skills (SQL, Excel, BI tools)
- Identify champions and early adopters
- Define SLAs per user type (response time, availability)
Technical Assessment
- Audit current infrastructure (on-premises, cloud, hybrid)
- Document existing integrations
- Evaluate security and compliance policies
- Identify network and connectivity constraints
- Catalog current licenses (Office 365, SQL Server, etc.)
Phase 2: Design (Week 3–4)
Conceptual Architecture
- Select architectural pattern (Data Warehouse/Lake/Lakehouse)
- Define data layers (Raw/Processed/Curated)
- Design partitioning and organization strategy
- Plan backup and disaster recovery strategy
- Define data retention policies
Data Modeling
- Design dimensional or hybrid model
- Define slowly changing dimensions (SCD)
- Plan aggregations and pre-calculations
- Design lineage tracking
- Document business glossary
Governance and Security
- Define roles and permissions (RBAC strategy)
- Plan sensitive data classification
- Design masking/anonimization strategy
- Configure auditing and logging
- Establish data access policies
Phase 3: Proof of Concept (Week 5–6)
Technical Validation
- Implement basic end-to-end pipeline
- Validate performance with real data
- Test failure and recovery scenarios
- Validate key integrations
- Measure load and query times
User Validation
- Build prototypes of key dashboards
- Validate use cases with real users
- Test self-service capabilities
- Measure usability and satisfaction
- Iterate based on feedback
Critical Mistakes and How to Avoid Them
Mistake #1: “Big Bang Migration”
❌ What NOT to do: Migrate all reports at once
✅ Best Practice: Iterative approach
- Start with 2–3 critical use cases
- Perfect the process
- Scale gradually
- Keep legacy systems during transition
Mistake #2: “Architectural Gold Plating”
❌ What NOT to do: Implement all capabilities “just in case”
✅ Best Practice: Evolutionary architecture
- Implement MVD (Minimum Viable Data architecture)
- Design for future extensibility
- Add complexity only when needed
- Monitor real usage vs. implemented capabilities
Mistake #3: “Ignoring Data Governance”
❌ What NOT to do: “Let’s implement first, governance later”
✅ Best Practice: Governance from day one
- Define data stewards early
- Implement data catalog early
- Establish data quality processes
- Document lineage from the first pipeline
Mistake #4: “Underestimating Change Management”
❌ What NOT to do: 100% technical approach
✅ Best Practice: 60% technical, 40% change management
- Involve end users from the design stage
- Plan training and onboarding
- Establish adoption metrics
- Create champions program
Mistake #5: “Premature Optimization”
❌ What NOT to do: Optimize for extreme cases from day one
✅ Best Practice: Data-driven optimization
- Implement performance monitoring from day one
- Optimize based on real usage patterns
- Use serverless when possible
- Scale on demand, not preventively
Validation and Testing Strategies
Performance Testing
Base Volume    → 1.5x → 3x → 5x → 10x
Base Users     → 2x → 5x → 10x → 25x
Complexity     → Simple → Medium → High
Recoverability Testing
- Simulate component failures
- Test backup recovery
- Validate RTO/RPO requirements
- Disaster recovery testing
Security Testing
- Penetration testing
- Permission validation
- Data masking testing
- Access auditing
Architectural Success Metrics
Technical Metrics
- Query Performance: P95 < 10 seconds for standard queries
- Data Freshness: < 4 hours for critical data
- Availability: 99.9% uptime
- Recovery Time: RTO < 4 hours, RPO < 1 hour
Adoption Metrics
- User Engagement: 70%+ monthly active users
- Self-Service Ratio: 80%+ queries without IT intervention
- Time to Insight: 60%+ reduction vs. previous process
Cost Metrics
- Cost per Query: Downward trend
- TCO vs. Legacy: 40–60% reduction in 24 months
- ROI: Positive within 18–24 months
Concrete Next Steps
This Week:
- Download our “Architecture Assessment Template” to evaluate your current situation
- Complete Phase 1 checklist with your team
- Identify your target architectural pattern using this article’s references
Next 2 Weeks:
- Create your conceptual architecture diagram using our templates
- Validate the design with key stakeholders (IT, Business, Finance)
- Identify skill gaps and training needs
Next Month:
- Develop your Proof of Concept plan
- Establish specific success metrics for your organization
- Create your implementation roadmap with clear milestones
Conclusion: Architecture as a Competitive Advantage
A well-designed architecture is not just a technical decision—it’s a strategic competitive advantage. Organizations that invest time in designing solid architectures from the start gain:
- Faster time-to-market for new insights and analytics
- Lower operational costs as they scale
- Greater agility to respond to business changes
- Solid foundation for future AI/ML initiatives
In our next article, “Azure Data Factory – Your First Data Pipeline,” we’ll put these architectures into action with step-by-step implementations, starting with the heart of data movement in Azure.
Is Your Current Architecture Scalable?
We offer a free Architecture Health Check where we audit your current implementation and identify specific optimization opportunities for your organization.
[Request Your Architecture Review] – 45-minute session with our senior architect
What architectural challenge is your organization facing right now? Share it in the comments and we’ll cover it in upcoming articles.
Next in the series: “Azure Data Factory – Your First Data Pipeline” – Step-by-step implementation of your first end-to-end data flow.